Monitoring OCM using OpenTelemetry Collector Addon and Prometheus-Operator
In this page, we provide a way to monitor your OCM environment using OpenTelemetry Collector Addon and Prometheus-Operator.
Overview
The OpenTelemetry Collector Addon is a pluggable addon for Open Cluster Management (OCM) that automates the deployment and management of OpenTelemetry collector on managed clusters. Built on the addon-framework, it provides observability and metrics collection capabilities across your multi-cluster environment.
┌─────────────────┐    ┌──────────────────┐    ┌──────────────────┐
│   Hub Cluster   │    │ Managed Cluster  │    │ Managed Cluster  │
│                 │    │                  │    │                  │
│ ┌─────────────┐ │    │ ┌──────────────┐ │    │ ┌──────────────┐ │
│ │ Prometheus  │ │◄───┤ │ OTEL         │ │    │ │ OTEL         │ │
│ │ (Remote     │ │    │ │ Collector    │ │    │ │ Collector    │ │
│ │ Write)      │ │    │ │              │ │    │ │              │ │
│ └─────────────┘ │    │ └──────────────┘ │    │ └──────────────┘ │
│                 │    │        │         │    │        │         │
│ ┌─────────────┐ │    │ ┌──────▼──────┐  │    │ ┌──────▼──────┐  │
│ │ OTEL Addon  │ │    │ │ Node Metrics│  │    │ │ Node Metrics│  │
│ │ Manager     │ │    │ │ cAdvisor    │  │    │ │ cAdvisor    │  │
│ └─────────────┘ │    │ └─────────────┘  │    │ └─────────────┘  │
└─────────────────┘    └──────────────────┘    └──────────────────┘
Before you get started
- You must have an OCM environment set up. You can also follow our recommended quick start guide to set up a playground OCM environment.
- You must have Helm 3.x installed.
- You have kubectl configured to access your hub cluster.
And then install the OpenTelemetry addon with automatic Prometheus stack and certificate generation:
# Clone the repository
git clone https://github.com/open-cluster-management-io/addon-contrib.git
cd addon-contrib/open-telemetry-addon

# Install everything (certificates, prometheus, addon)
oc config use-context kind-hub # run it in hub cluster
make install-all
Refer to the OpenTelemetry Collector Addon README for more configuration options and verification steps.
Monitoring the control-plane resource usage
You can use kubectl proxy to proxy the prometheus service to your localhost:
kubectl --namespace monitoring port-forward svc/prometheus-stack-kube-prom-prometheus 9090
Then, open your browser and navigate to https://localhost:9090 to access the Prometheus UI.
The following queries are to monitor the control-plane pods’ cpu usage, memory usage and apirequestcount:
rate(container_cpu_usage_seconds_total{namespace=~"open-cluster-management.*"}[3m])
container_memory_working_set_bytes{namespace=~"open-cluster-management.*"}
rate(apiserver_request_total{resource=~"managedclusters|managedclusteraddons|managedclustersetbindings|managedclustersets|addonplacementscores|placementdecisions|placements|manifestworks|manifestworkreplicasets"}[1m])
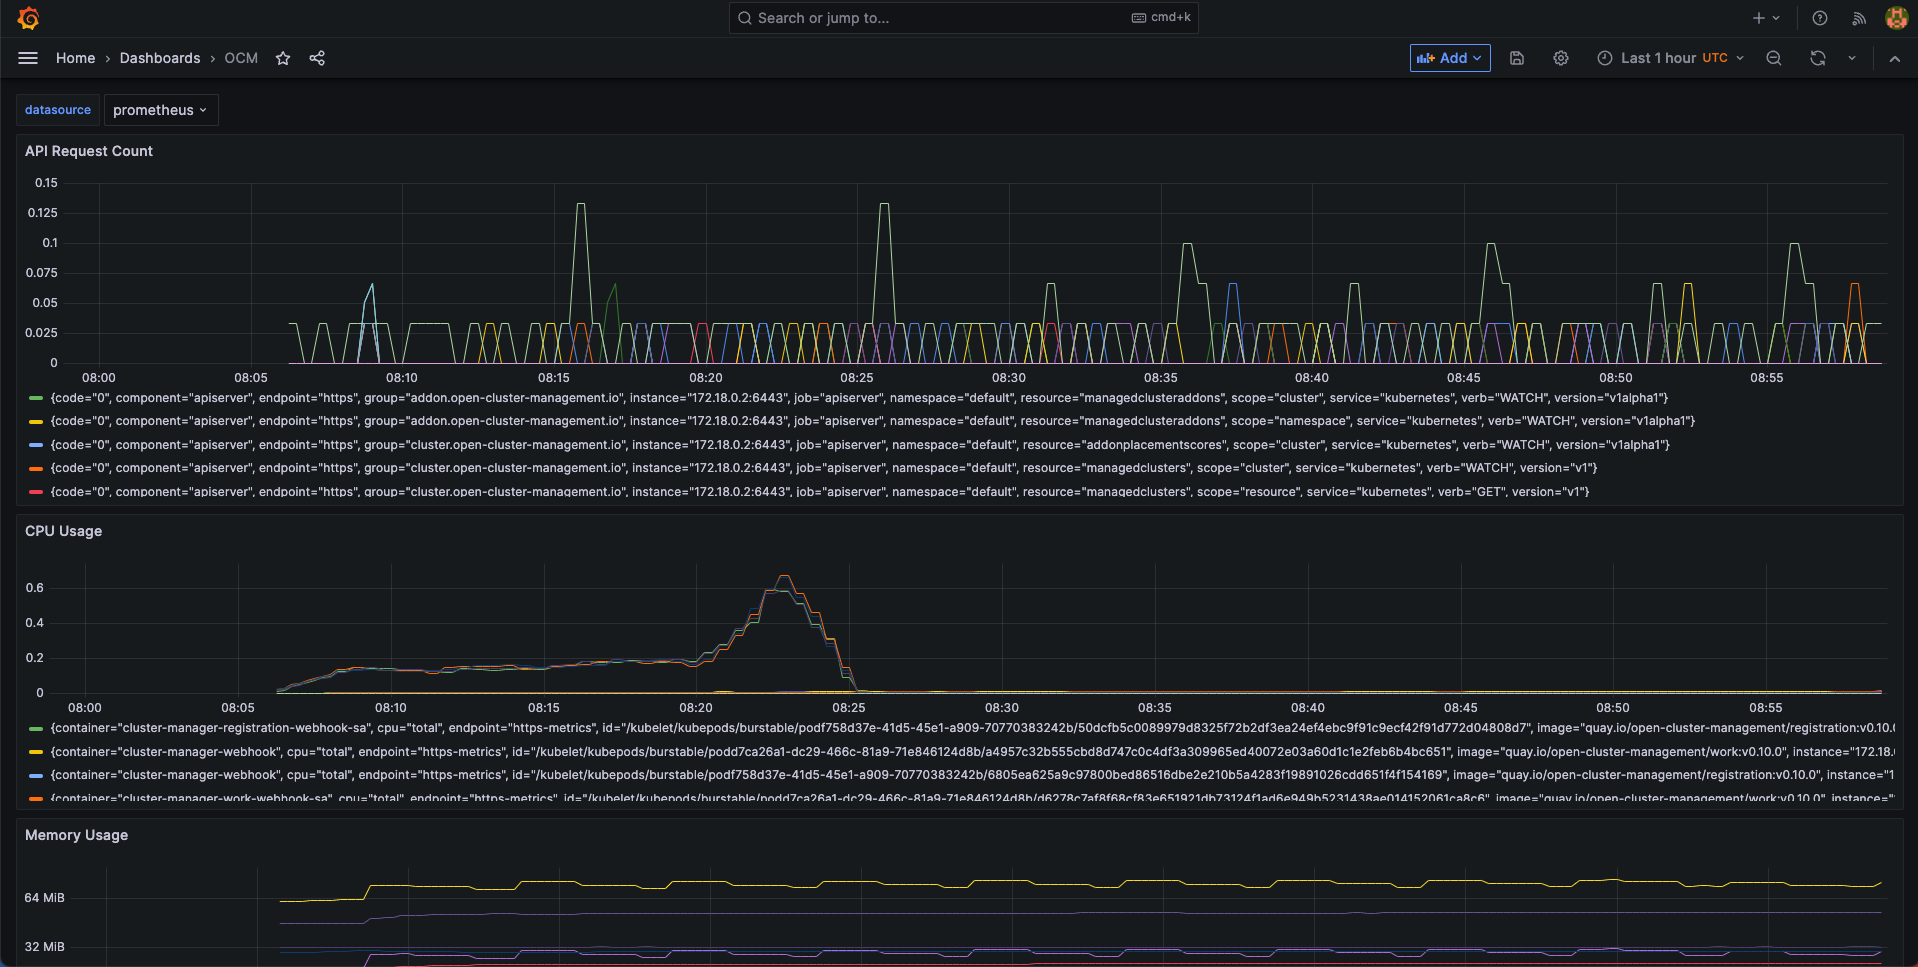
Visualized with Grafana
We provide an initial grafana dashboard for you to visualize the metrics. But you can also customize your own dashboard.
First, use the following command to proxy grafana service:
kubectl --namespace monitoring port-forward svc/prometheus-stack-grafana 80
Next, open the grafana UI in your browser on localhost:80. Get Grafana ‘admin’ user password by running:
kubectl --namespace monitoring get secrets prometheus-stack-grafana -o jsonpath="{.data.admin-password}" | base64 -d ; echo
Click the “Import Dashboard” and run the following command to copy a sample dashboard and paste it to the grafana:
curl https://raw.githubusercontent.com/open-cluster-management-io/open-cluster-management-io.github.io/main/content/en/docs/getting-started/administration/assets/grafana-sample.json | pbcopy
Then, you will get a sample grafana dashboard that you can fine-tune further: