Monitoring OCM using Prometheus-Operator
In this page, we provide a way to monitor your OCM environment using Prometheus-Operator.
Before you get started
You must have a OCM environment setuped. You can also follow our recommended quick start guide to set up a playgroud OCM environment.
And then please install the Prometheus-Operator in your hub cluster. You can also run the following commands copied from the official doc:
git clone https://github.com/prometheus-operator/kube-prometheus.git
cd kube-prometheus

# Create the namespace and CRDs, and then wait for them to be availble before creating the remaining resources
kubectl create -f manifests/setup

# Wait until the "servicemonitors" CRD is created. The message "No resources found" means success in this context.
until kubectl get servicemonitors --all-namespaces ; do date; sleep 1; echo ""; done

kubectl create -f manifests/
Monitoring the control-plane resource usage.
You can use kubectl proxy to open prometheus UI in your browser on localhost:9090:
kubectl --namespace monitoring port-forward svc/prometheus-k8s 9090
The following queries are to monitor the control-plane pods’ cpu usage, memory usage and apirequestcount for critical CRs:
rate(container_cpu_usage_seconds_total{namespace=~"open-cluster-management.*"}[3m])
container_memory_working_set_bytes{namespace=~"open-cluster-management.*"}
rate(apiserver_request_total{resource=~"managedclusters|managedclusteraddons|managedclustersetbindings|managedclustersets|addonplacementscores|placementdecisions|placements|manifestworks|manifestworkreplicasets"}[1m])
Visualized with Grafana
We provide a intial grafana dashboard for you to visualize the metrics. But you can also customize your own dashboard.
First, use the following command to proxy grafana service:
kubectl --namespace monitoring port-forward svc/grafana 3000
Next, open the grafana UI in your browser on localhost:3000.
Click the “Import Dashboard” and run the following command to copy a sample dashboard and paste it to the grafana:
curl https://raw.githubusercontent.com/open-cluster-management-io/open-cluster-management-io.github.io/main/content/en/getting-started/administration/assets/grafana-sample.json | pbcopy
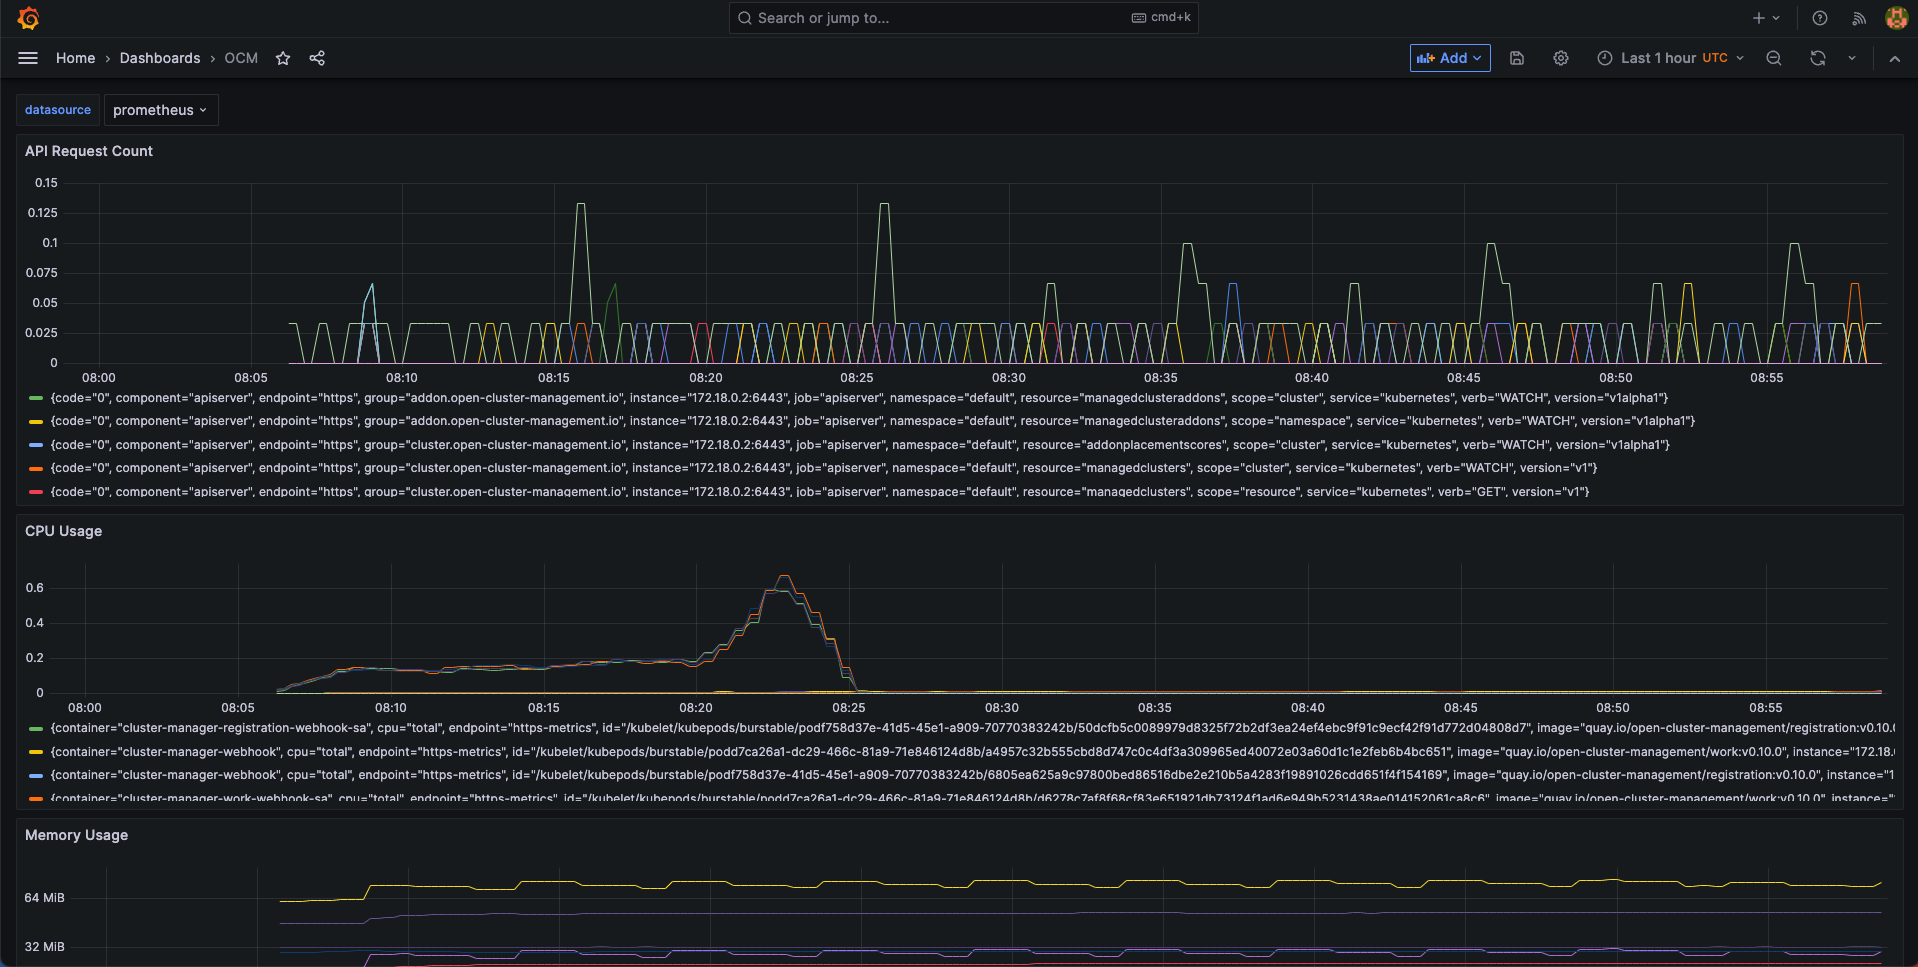
Then, you will get a sample grafana dashboard that you can fine-tune further: